

Against Late Fall Hardwoods, Taramac scores 65/100 (), while Venator scores 44/100 ().
Based on color alignment, breakup scale, and texture density, the AI sees an approximate 21-point lean toward Taramac in this particular environment.
King of the Mountain Taramac runs micro-scale, while Rocky Venator leans more mixed-scale, giving each a slightly different feel at various distances. King of the Mountain Taramac leans toward micro-scale detail, while Rocky Venator balances micro and macro elements, which shifts how each holds up in close cover versus more open sightlines. They are also similar in overall density, so neither one is dramatically busier or more open.
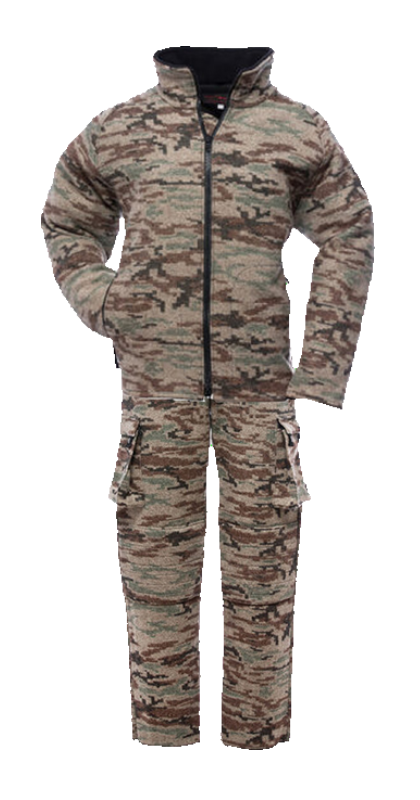
King of the Mountain Taramac vs Rocky Venator
King of the Mountain Taramac and Rocky Venator have been analyzed using our CamoMatrix AI engine, which measures scale, density, and edge behavior directly from the flat pattern artwork. King of the Mountain Taramac reads more micro-scale, while Rocky Venator trends mixed-scale. In the field this usually influences how a pattern holds together in tight cover versus more open terrain. Density is similar, so neither pattern overwhelms the eye or leaves too much empty space. Edge work is alike as well — both mixes both hard and soft edges, which affects how smoothly (or abruptly) each pattern merges with real brush, trunks, and rocks. Rocky Venator's numeric scale index runs slightly higher, nudging it a bit more toward macro breakup, while King of the Mountain Taramac stays finer on average. King of the Mountain Taramac runs a little denser on our readings, while Rocky Venator leaves slightly more background showing through — which some hunters prefer in simpler, more open environments. As always, these results come from flat pattern imagery. Real-world performance depends heavily on terrain, season, and how the garments fit and move.
This is a pattern-only comparison from flat artwork. Terrain, season, and real backgrounds will still push one or the other ahead in specific setups.

Learn how the CamoMatrix AI evaluates camouflage patterns
Defines the dominant size of shapes in the pattern.
Indicates which scale range the pattern leans toward overall.
How busy the pattern is with shapes and noise.
How hard or soft shape boundaries are.